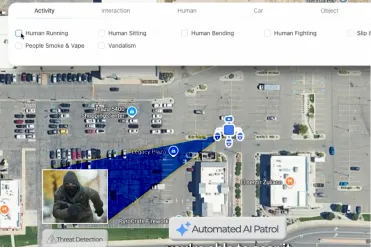
The AI Activity Map gives your team a full visual overview of activity captured by your Duck View Systems mobile surveillance units. Every alert, motion event, and AI-triggered detection is plotted on an interactive, site-wide map, helping you see exactly where incidents happen and how they evolve over time.
Instead of reviewing alerts one by one, the Activity Map shows the full picture: locations, trends, hotspots, and repeat problem areas.
What Is the AI Activity Map?
AI Activity Map is an interactive visualization feature built into the Duck View Systems mobile surveillance trailer. It maps all AI-driven alerts, object detections, and trailer events onto a GPS-based site layout, making it easier for teams to understand where activity is concentrated.
The system collects timestamps, event types, and camera IDs, then displays them as intuitive markers on your site map. This provides powerful insight into how movement, alerts, and suspicious patterns shift across hours, days, or weeks.
Maps all AI events—movement, detections, alerts—onto a site-wide interface
Visualizes where activity is happening with location-based event markers
Identifies alert clusters, repeat hotspots, and high-risk movement patterns
Displays historical data with filterable timelines
Tracks multiple Duck View Systems units across large properties
Offers heat-map style intensity views for high-alert zones
Shows real-time events as they occur
Supports Duck View Systems’ mobile surveillance trailers and fixed-camera units
Why the AI Activity Map Matters
Understanding the “where” and “when” behind incidents helps your team respond smarter, not just faster. With Activity Mapping, you gain visibility into site-wide behavior patterns, allowing you to position units more effectively and anticipate issues before they escalate.
The AI Activity Map helps you:
Identify High-Alert Locations
Heat mapping shows which areas generate the most activity, helping optimize camera and trailer placement.
Analyze Activity Over Time
Timeline controls let you scroll through past hours, days, or weeks to understand recurring patterns.
Monitor Multiple Units Easily
Map view shows all Duck View Systems trailers and cameras operating across your entire property.
Improve Nighttime and After-Hours Insight
Activity data reveals movement that happens when nobody is on-site.
Support Investigations with Event Details
Each map marker includes timestamps, snapshots, and AI categories for fast follow-up and documentation.
As your Duck View Systems unit detects motion, loitering, tripwire crossings, intrusion activity, or other AI-triggered events, each detection is logged with exact timestamps, camera IDs, and location coordinates.
2. System Plots Events on a Dynamic Map
The platform overlays these detection points onto your site layout, GPS-based or custom-drawn, creating precise event markers that show where activity occurred.
3. Timeline Filters Organize Activity
Operators can filter events by hour, event category, trailer, or specific camera to review historical patterns or isolate key moments across the timeline.
4. Heat Zones Highlight Problem Areas
AI aggregates event frequency and intensity to display heat-mapping zones, helping identify repeated activity, high-traffic paths, or alert clusters that may need additional oversight.
5. Real-Time Updates Keep You Informed
New detections appear instantly on the Activity Map without needing to refresh the page, giving your team immediate visual awareness of what is happening across the site.
This makes documentation and investigations far more accurate.
Want a system that visually shows where incidents take place?
Monitor pathways, public access areas, fenced utilities, and multi-building layouts.
Technical Highlights of AI Activity Map
Map View: Plots all AI events across a GPS or site-drawn layout.
Timeline Controls: Filter activity by hour, day, week, or custom ranges.
Event Markers: Color-coded markers show alert types, timestamps, and camera IDs.
Heat Mapping: Visual density layers highlight repeated activity or hotspots.
Unit Tracking: Shows multiple Duck View Systems trailers on the same map.
Real-Time Updates: New alerts appear instantly without reload.
Camera Integration: Works with both PTZ and fixed cameras.
Connectivity: Designed for LTE-connected, remote, and off-grid deployments.
Is Your Site Showing You the Full Picture?
AI Activity Map reveals where activity happens, when it happens, and how it spreads—giving your Duck View Systems unit a powerful visual layer of awareness. See every alert at a glance. Understand site-wide movement patterns. Make smarter adjustments.
It visualizes AI-triggered events—movement, detections, alerts—on a map-based interface.
Does it track multiple units?
Yes. All Duck View Systems trailers and cameras appear on the same map.
Can I review past activity?
Yes. Timeline filters allow you to scroll through historical event data.
Is it real-time?
Yes. Events appear on the map instantly as your unit detects them.
Does it help with optimizing trailer placement?
Yes. Heat maps and cluster patterns help identify high-alert areas.
Enhance Your Awareness with AI Activity Map
The AI Activity Map does more than show alerts — it reveals the behavior behind them. Hotspots, clusters, and routes appear visually, helping you understand how people and vehicles move through your site. With this insight, your Duck View Systems unit helps you adjust placement, routing, and oversight proactively.
See the data that helps you stay one step ahead.
AI Activity Map doesn’t just show you events, it shows you where your next risk is coming from.